
Connector Industry Yearbook
| Report Number: C-122-23 |
Price:
$1500.00
|
| Publication Date: June 2023 |
This is invisible
2023 Connector Industry Yearbook
Each year, Bishop & Associates prepares the Connector Industry Yearbook based on annual reports provided by publicly traded connector companies.
Income statements and balance sheets are consolidated for the past 10 years, five years, and most current year, providing benchmarks on the industry and the overall performance of the public connector companies. Featured in each issue are: consolidated history of the public companies, fifteen-year history of performance by company (including industry averages), and a chronological description of important 2021 industry events.
Add a Subscription to The Bishop Report Monthly Newsletter
UPGRADE - Add a single user annual subscription to The Bishop Report (Single User +$250) Total $1,750 Single User License.
UPGRADE - Add a corporate license annual subscription to The Bishop Report (Corporate License-unlimited subscribers from the same company +$1,450) Total $2,950 Corporate License
This is invisible
2023 Connector Industry Yearbook
Table of Contents
PROLOGUE
CHAPTER 1 - THE WORLD ELECTRONIC CONNECTOR INDUSTRY
- The Last Ten Years (2012-2022)
- Table: Sales by Geographic Region
- Graph: Change by Geographic Region 2012 vs 2022
- The Last Five Years (2018-2022)
- Table: Sales by Geographic Region
- Graph: World Connector Industry – Year-To-Year Percent Change in Growth
- Graph: North American Market Year-to-Year Growth 1980-2023F
- Graph: European Market Year-to-Year Growth 1980-2023F
- Graph: Japanese Market Year-to-Year Growth 1980-2023F
- Graph: Chinese Market Year-to-Year Growth 1995-2023f
- Graph: Asia Pacific Market Year-to-Year Growth 1980-2023F
- Graph: ROW Market Year-to-Year Growth 1980-2023F
- Last Year - 2022
- Table: 2020-2022 Percent Change in Growth by Region
- Table: 2020-2022 Percent Share of Market by Region
- Equipment Sector Sales – 2020-2022
- Table: 2020-2022 Percent Change in Equipment Sales by Equipment Sector
- Table: 2022 World Sales by Equipment Sector
- Graph: 2022 World Connector Sales by Equipment Sector
- Graph: 2022 World Connector Market Top 5 Equipment Sectors
- Forecast
- 2023 and 2028 Forecast by End-Use Market
- 2023 and 2028 Forecast by Connector Category
- Mergers and Acquisitions
- Key Technology Trends 2023
- Lead Times
- Price Trends
CHAPTER 2 - 2022 SIGNIFICANT EVENTS
CHAPTER 3 - CONSOLIDATED KEY PERFORMANCE MEASURES
- Consolidated Key Performance Measures
- Key Financial Measurements (2011-2021)
- Charts: Key Financial Measurements
- Balance Sheet $ (2012-2022)
- Balance Sheet % (2012-2022)
- Income Statement $ (2012-2022)
- Income Statement % (2012-2022)
- Performance History by Company
- Selected Connector Manufacturers
- Cost-of-Goods Sold
- Cost of Goods Sold % (2008-2022)
- Selling, General & Administrative (SG&A)
- Selling, General, & Administrative % (2008-2022)
- COGS+SG&A
- COGS + SG&A % (2008-2022)
- Net Income History
- Net Income % (2008-2022)
- Current Ratio
- Current Ratio (2008-2022)
- Return on Assets
- Return on Assets (2008-2022)
- Return on Equity
- Return on Equity (2008-2022)
- Long Term Debt/Equity
- Long Term Debt/Equity (2008-2022)
- Liabilities to Equity
- Liabilities to Equity (2008-2022)
- Accounts Receivable Turnover
- Accounts Receivables Turnover (2008-2022)
- Average Collection Period
- Average Collection Period (2008-2022)
- Inventory Turns
- Inventory Turns (2008-2022)
- Days Inventory
- Days Inventory (2008-2022)
CHAPTER 4 - PERFORMANCE HISTORY OF SELECTED COMPANIES
Performance History of Selected Companies
Amphenol Corporation
- Key Financial Measurements
Charts: Key Financial Measurements
Balance Sheet $ (2012-2022)
Balance Sheet % (2012-2022)
Income Statement $ (2012-2022)
Income Statement % (2012-2022)
Cheng Uei Precision Co. Ltd. (Foxlink)
- Key Financial Measurements
- Charts: Key Financial Measurements
- Balance Sheet $ (2012-2022)
- Balance Sheet % (2012-2022)
- Income Statement $ (2012-2022)
- Income Statement % (2012-2022)
FIT Hon Teng Ltd.
- Key Financial Measurements
- Charts: Key Financial Measurements
- Balance Sheet $ (2013-2022)
- Balance Sheet % (2013-2022)
- Income Statement $ (2013-2022)
- Income Statement % (2013-2022)
Hirose Electric Co., Ltd.
- Key Financial Measurements
- Charts: Key Financial Measurements
- Balance Sheet $ (2012-2022)
- Balance Sheet % (2012-2022)
- Income Statement $ (2012-2022)
- Income Statement % (2012-2022)
Hosiden
- Key Financial Measurements
- Charts: Key Financial Measurements
- Balance Sheet $ (2012-2022)
- Balance Sheet % (2012-2022)
- Income Statement $ (2012-2022)
- Income Statement % (2012-2022)
HUBER+SUHNER
- Key Financial Measurements
- Charts: Key Financial Measurements
- Balance Sheet $ (2012-2022)
- Balance Sheet % (2012-2022)
- Income Statement $ (2012-2022)
- Income Statement % (2012-2022)
Japan Aviation Electronics Industry (JAE), Limited
- Key Financial Measurements
- Charts: Key Financial Measurements
- Balance Sheet $ (2012-2022)
- Balance Sheet % (2012-2022)
- Income Statement $ (2012-2022)
- Income Statement % (2012-2022
Korea Electric Terminal Co. Ltd.
- Key Financial Measurements
- Charts: Key Financial Measurements
- Balance Sheet $ (2013-2022)
- Balance Sheet % (2013-2022)
- Income Statement $ (2013-2022)
- Income Statement % (2013-2022)
SMK
- Key Financial Measurements
- Charts: Key Financial Measurements
- Balance Sheet $ (2012-2022)
- Balance Sheet % (2012-2022)
- Income Statement $ (2012-2022)
- Income Statement % (2012-2022)
TE Connectivity
- Key Financial Measurements
- Charts: Key Financial Measurements
- Balance Sheet $ (2012-2022)
- Balance Sheet % (2012-2022)
- Income Statement $ (2012-2022)
- Income Statement % (2012-2022)
This is invisible
2023 Connector Industry Yearbook
Each year, Bishop & Associates prepares the Connector Industry Yearbook based on annual reports provided by publicly traded connector companies. Income statements and balance sheets are consolidated for the past 10 years, five years, and most current year, providing benchmarks on the industry and the overall performance of the public connector companies.
In addition, the report provides a review of the connector industry for the period 2012-2022 for sales by region, end-use equipment sector and our current forecast for 2023 and 2028 by region and end-use equipment sector.
This report features:
Consolidated history of the public companies including:
- Key Financial Measurements (2012-2022)
- Balance Sheet $ (2012-2022)
- Income Statement $ (2012-2022)
- Balance Sheet percent (2012-2022)
- Income Statement percent (2012-2022)
Fifteen-year history of performance by company, with industry averages for the following financial measurements:
- Selling, General, & Administrative percent (2008-2022)
- Net Income percent (2008-2022)
- Return on Assets (2008-2022)
- Long Term Debt/Equity (2008-2022)
- Accounts Receivables Turnover (2008-2022)
- Inventory Turns (2008-2022)
- Cost of Goods Sold percent (2008-2022)
- COGS + SG&A percent (2008-2022)
- Current Ratio (2008-2022)
- Return on Equity (2008-2022)
- Liabilities to Equity (2008-2022)
- Average Collection Period (2008-2022)
- Days Inventory (2008-2022)
2022 Yearbook Companies Gross Income as a Percent of Sales
The following table provides Net Income as a percent of sales from 2012-2022 for public companies included in the 2023 Connector Industry Yearbook.
Net Income
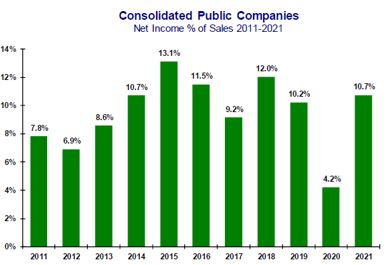
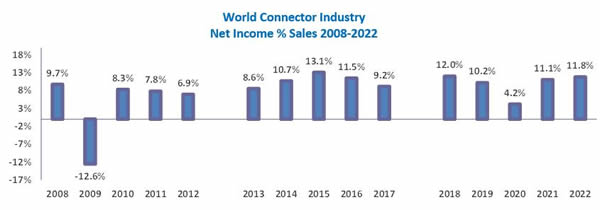
In 2022 the connector industry had an average net income of 11.8% of sales, compared with 11.1% in 2021 and 4.2% in 2020. The reduction in profits in 2020 can largely to attributed to COVID-19 pandemic that slowed sales worldwide. 2018 was a significant year in United States which passed the Tax Cuts and Jobs Act which reduced the federal corporate income tax from 35% to 21%.
As a result of the worldwide economic downturn in 2009, the lowest net income as a percent of sales occurred in 2009 at -12.6%. This was the first time that net income had been a negative number for the consolidated public companies. Between 2013 and 2017, net income increased from 8.6% of sales in 2013 to 9.2% of sales in 2017. Between 2018 and 2022, net income decreased from 12.0 % in 2018 to 11.8% in 2022.
The following chart provides a history of net income for the Connector Industry from 2008-2022.
Download a descriptive brochure here


