
Non-Automotive Transportation Market for Connectors
| Report Number: m-4100-20 |
Price:
$5135.00
|
| Publication Date: February 2020 |
This is invisible
Non-Automotive Transportation Market for Connectors
Bishop & Associates latest research report, Non-Automotive Transportation Market for Connectors examines the technology, trends, and products that are driving the growth of the various sub-sectors within the transportation market. Forecasts by transportation sector, product type and region are provided, along with five-year compound average growth rate projections. This report examines the following questions, and more.
- Which mode of transportation, rail & rolling stock, commercial air, commercial vehicle, commercial marine, or other accounted for the highest connector sales in 2019? Which mode is anticipated to account for the greatest growth in 2025?
- What trends are driving the growth, or decline, of the commercial air, rail & rolling stock, commercial vehicles or any of the other sub-sectors in the transportation sector? What role are environmental regulations playing in the various sub-sectors? Are these regulations driving the growth of alternative power sources and what are these alternatives?
- What networking protocols are most prominent by sub-sector? How does growth of networking and use of IoT affect connector consumption?
- Which connector type is anticipated to show the most growth during the five-year period 2020F through 2025F? Which regions will outgrow other regions and what is the background of this growth?
This is invisible
Non-Automotive Transportation Market for Connectors
Table of Contents
Chapter 1 – Introduction
- Introduction
- Air
- Sea
- Rail
- Road
- Technology and Connectivity
- Connector Consumption by Key Product Category 2018, 2019, and 2020F with Percent Growth
Chapter 2 – Executive Summary
- Executive Summary
- Connector Consumption in the Transportation Market by Region 2018 and 2019
- Regional Shares of the Transportation Connector Market by Sub-Sector 2019
- Connector Consumption in the Transportation Market by Region 2020F and 2025F with Five-Year CAGR and Market Share
- Relative Size, 10-Year Historic Growth and Five-Year Forecasted Growth of Connector Sales in the Transportation Market by Region
- Civil Aviation
- Connector Consumption in Civil Aviation by Region 2019, 2020F, and 2025F with Five-Year CAGR and 2025 Market Share
- Marine
- Connector Consumption in the Marine Market by Region 2019, 2020F, and 2025F with Five-Year CAGR and 2025 Market Share
- Commercial Vehicles
- Connector Consumption in the Commercial Vehicles Market by Region 2019, 2020F, and 2025F with Five-Year CAGR and 2025 Market Share
- Rail & Rolling Stock
- Connector Consumption in the Railway Market by Region 2019, 2020F, and 2025F with Five-Year CAGR and 2025 Market Share
- Heavy Equipment
- Connector Consumption in the Heavy Equipment and Farm and Garden Market by Region 2019, 2020F, and 2025F with Five-Year CAGR and 2025 Market Share
- Recreational and Power Sports Vehicles
- Connector Consumption in the Recreational and Power Sport Market by Region 2019, 2020F, and 2025F with Five-Year CAGR and 2025 Market Share
Chapter 3 – Commercial Air
- Market Definition
- Aircraft Types and Market Segmentation
- Commercial Aircraft – Single Aisle and Wide-Body Airliners
- Commercial Aircraft – Regional Aircraft
- General Aviation – Private Aircraft and Rotorcraft
- Drones and UAV
- Simulators and Training
- Commercial Spacecraft
- Commercial Aircraft: Orders and Deliveries
- Commercial Aviation Deliveries and Orders
- Boeing
- Boeing Aircraft Deliveries 2010-2019
- Boeing Net Orders by Model
- Airbus
- Airbus Aircraft Deliveries 2010-2019
- Airbus Aircraft Net Orders 2010-2019
- Boeing and Airbus Combined
- Boeing and Airbus Deliveries and Orders 2010-2019
- Other Commercial Aircraft Manufacturers (OEM)
- General Aviation: Orders and Deliveries
- General Aviation Shipments 2015-2019E
- General Aviation Billings 2016-2019E
- US – Manufactured General Aviation Airplane Shipments 2017 – 2018
- Europe – Manufactured General Aviation Airplane Shipments 2017 – 2018
- Global Production Share 2018 North America and Europe Combined
- Other Aviation Segments
- Technical Standards and Connector Requirements
- Aviation Standards and Governance
- Airworthiness and Safety
- FAA Parts Manufacturer Approvals (PMA)
- ARINC Standards
- Connector Consumption in the Civil Aviation Market
- Connector Consumption in Civil Aviation by Region 2018 and 2019 with Percent Change and 2019 Market Share
- Connector Consumption in Civil Aviation by Region 2019, 2020F, and 2025F with Five-Year CAGR and 2025F Market Share
- Connector Consumption in Civil Aviation by Product Category 2018, 2019, and 2020F with Percent Change
- Top Five Connector Categories Civil Aviation – 2019
Chapter 4 – Railway Market: Rolling Stock, Infrastructure, and Signaling
- Railway Industry Market Segments, Leading OEMs, and Regions
- Leading Rolling Stock and Railway OEMs
- Leading Countries/Regions by Total Track Length (2017)
- Digital Transformation Trends in Rail Transport
- Market Trends in the Global Rail Industry
- Average Annual Rail Market Volume 2015-2017 by Segment
- Regional Markets
- China
- Europe
- Private Investments in Rolling Stock in Europe Growing
- North America
- Japan
- Asia Pacific
- India
- South Korea
- Malaysia
- Row
- Russia
- South Africa
- Locomotive Traction Systems and Technologies
- Locomotive Power Sources
- Standard-Compliant Technology
- Component Certification
- Component Certification
- Strategic Plans Shaping the Future of the Rail Industry
- Signaling and Infrastructure: ERTMS
- Signaling and Infrastructure: PTC
- How PTC Works
- Railway Outlook & Forecast
- Railway Regional Outlook
- Regional Railways Market for OEM and After Sales Combined for 2017 with 2017 through 2022 Five-Year CAGR
- Railway OEM and After Sales Market 2017 with Five-Year (2017 through 2022) CAGR
- Leading Railway OEM
- Connector Consumption in the Rail & Rolling Stock Market
- Connector Consumption in the Rail & Rolling Stock Market by Region 2018 and 2019 with Percent Growth and 2019 Market Share
- Connector Consumption in the Rail & Rolling Stock Market by Region 2019, 2020F, and 2025F with Five-Year CAGR and 2025F Market Share
- Connector Consumption in the Rail & Rolling Stock Market by Product Category 2018, 2019, and 2020F
- Top Five Connector Categories Rail & Rolling Stock – 2019
Chapter 5 – Commercial Vehicles
- Commercial Vehicles Market Segmentation
- Market Trends in the Global Commercial Vehicle Industry
- Electrification Trends in Commercial Vehicles
- European Regulation (EU) 2019/1242
- Electric Commercial Vehicles Market Shares
- Bus Manufacturers and New Registrations in Western Europe and Poland – 2017 and 2018
- Trend of EV Share as Percentage of Sales by Segment through 2040 (BNEF)
- Trend of EV Share as Percentage of Sales by Region – Short and Long Term (BNEF)
- Natural Gas Vehicles (NGV)
- Hydrogen Fuel Cell Technology
- The Regulatory Push
- Key Regulations by Region
- Advanced Electronics for Trucks and Buses – Connected Vehicles
- Truck Platooning
- Commercial Vehicle Production
- Global Production Volume Buses and Coaches 2017 and 2018
- Global Production Volume Medium/Heavy Trucks 2017 and 2018
- Connector Consumption in the Commercial Vehicles Market
- Connector Consumption in the Commercial Vehicles Market by Region 2018 and 2019
- Connector Consumption in the Commercial Vehicles Market by Region 2019, 2020F, and 2025 with Five-Year CAGR
- Connector Consumption in the Commercial Vehicles Market by Product Category 2018, 2019, and 2020F
- Top Five Connector Categories Commercial Vehicles – 2019
Chapter 6 – Commercial Marine
- Commercial Marine Market Overview and Segmentation
- World Fleet by Principal Vessel Type – Share of Tonnage (DWT) - 2018
- Building, Ownership, Registration and Scrapping of Ships – 2017 Percentage of World Total
- Manufacturing Time by Transportation Mode
- Key Manufacturers in Worldwide Shipbuilding Market
- Shipyards: Order Intake in Ships and Value
- Components and Systems Certification
- Commercial Marine Systems and Applications
- Value Chain in Shipbuilding
- Engines, Propulsion, and Gears
- Navigation, Control, and Communication
- Entertainment Solutions
- Market Trends in the Global Commercial Marine Industry
- Shipping Transitions to a Lower Carbon Future
- IMO 2020
- Commercial Marine Production Outlook and Forecast
- Regional Outlook
- North America
- Shipbuilding Market Share, Orders, and Deliveries 2017 and 2018 by Country/Region
- Orders for Specialized Vessels 2017 and 2018
- Global Deliveries versus New Orders in Million DWT Between 2010 and 2019E
- Connector Consumption in the Commercial Marine Market
- Connector Consumption in the Marine Market by Region 2018 and 2019
- Connector Consumption in the Marine Market by Region 2019, 2020F, and 2025F with Five-Year CAGR
- Connector Consumption in the Marine Market by Product Category 2018, 2019, and 2020F
- Top Five Connector Categories Marine Applications – 2019
Chapter 7 – Heavy Equipment
- Heavy Equipment Market Overview and Segmentation
- Construction Equipment Market
- Equipment Categories Global Sales Share 2018
- Agriculture – Farm Equipment Market
- Tractor Registrations in Europe by Country January to June 2018 vs 2019
- Mining Equipment Market
- 2017 Equipment Shares by Mining Application
- Market Trends in the Agriculture Equipment Industry
- Agribots and Drones
- Smart Tractors
- ISOBUS: Communication Nodes in Off-highway Vehicle Application
- Electric Farm Vehicles
- Market Trends in the Construction Equipment Industry
- Emission Standards
- China
- India
- Europe
- North America
- Market Trends in the Mining Equipment Industry
- Automation and IoT
- Use of Artificial Intelligence
- Connector Consumption in the Heavy Equipment Market
- Connector Consumption in the Construction Equipment Market by Region 2018 and 2019
- Connector Consumption in the Farm and Garden Equipment Market by Region 2018 and 2019
- Connector Consumption in the Construction Equipment Market by Region 2019, 2020F, and 2025F with Five-Year CAGR and 2025F Market Share
- Connector Consumption in the Farm and Garden Equipment Market by Region 2019, 2020F, and 2025F with Five-Year CAGR and 2025F Market Share
- Connector Consumption in the Construction Equipment Market by Product Category 2018, 2019, and 2020F
- Connector Consumption in the Farm & Garden Equipment
- Market by Product Category 2018, 2019, and 2020F
- Top Five Connector Categories Heavy Equipment Market – 2019
Chapter 8 – Recreation and Power Sport Vehicles
- RVs
- Motorhomes
- Campervans
- Towable RVs
- Fifth Wheels
- Travel Trailers
- Pop-Ups
- Smart Home Technology to the RV
- Regional Analysis
- North America
- North American RV Sales in Units 2008 through 2018 with Percent Change and 10-Year CAGR
- Europe
- Touring and Motor Caravans by European Country 2017 and 2018 with Percent Change
- China
- Asia Pacific
- Off-Road Vehicles – ATVs, UTVs, SSVs, and Snowmobiles
- Snowmobiles
- Snowmobile Sales by Country 2018 and 2019 with Percent Change
- ATVs, UTVs, and SSVs
- Connector Consumption in the Recreational and Power Sport Vehicles Market
- Connector Consumption in the Recreational and Power Sport Vehicles Market by Region 2018 and 2019
- Connector Consumption in the Recreational and Power Sport Vehicles Market by Region 2019, 2020F, and 2025F with Five-Year CAGR and 2025F Market Share
- Connector Consumption in the Recreational and Power Sport Vehicles Market by Product Category 2018, 2019, and 2020F
- Top Five Connector Categories Recreational and Power Sport Vehicles Market – 2019
Chapter 9 – Technology Overview: Data Networks and Connector Types
- Network Connectivity
- Road Vehicles and Heavy Equipment Data Networks
- SAE J1939 and CAN Bus
- Aircraft Data Networks
- Wire Harnesses and Interconnects
- Aviation Wire Harness
- ARINC 429
- Mil-STD-1553B
- ARINC 664 – AFDX - Ethernet
- Rail & Rolling Stock Data Networks
- ERTMS
- Marine and Offshore Data Networks
- NMEA 0183
- NMEA 2000
- Shipboard Internet of Things (IoT)
- Connector Technology in the Non-Auto Transportation Industry
- Connectors Used in Commercial Vehicles and Heavy Equipment
- Agriculture Applications
- Connectors Used in Aviation Applications
- Commercial Off-the-Shelf Strategy
- Build-to-Print – BTP
- Build-to-Specification – BTS
- ARINC Standard Interconnects
- ARINC 404 Series
- ARINC 600 Series
- ARINC Standard 801-3 Fiber Optic Connectors
- MIL-PRF-39012 – RF Connections
- MIL-DTL-38999 Circular Connectors
- MIL-DTL-83723/Mil-DTL-5015
- MIL-DTL-26482
- MIL-DTL-5015
- MIL-C-39029
- Connectors Used in Rail Sector Applications
- Connectors Used in Marine Applications
Chapter 10 – Statistical Overview of the Non-Automotive Transportation Market for Connectors
- Total World
- Total World Non-Automotive Transportation Connector Sales by Region 2018 through 2025 with Percent Change and Five-Year CAGR
- Total World Non-Automotive Transportation Connector Sales by Region 2020F versus 2025F
- Total World Transportation Market Share by Region 2020F
- Total World Transportation Market Share by Region 2025F
- Total World Non-Automotive Transportation Connector Sales by Sub-Sector 2018 through 2025F with Percent Change and Five-Year CAGR
- Total World Transportation Market Share by Sub-Sector 2020F
- Total World Transportation Market Share by Sub-Sector 2025F
- North American Non-Automotive Transportation Connector Sales by Sub-Sector 2018 through 2025F with Percent Change and Five-Year CAGR
- European Non-Automotive Transportation Connector Sales by Sub-Sector 2018 through 2025F with Percent Change and Five-Year CAGR
- Japanese Non-Automotive Transportation Connector Sales by Sub-Sector 2018 through 2025F with Percent Change and Five-Year CAGR
- Chinese Non-Automotive Transportation Connector Sales by Sub-Sector 2018 through 2025F with Percent Change and Five-Year CAGR
- Asia Pacific Non-Automotive Transportation Connector Sales by Sub-Sector 2018 through 2025F with Percent Change and Five-Year CAGR
- ROW Non-Automotive Transportation Connector Sales by Sub-Sector 2018 through 2025F with Percent Change and Five-Year CAGR
- Total World Transportation Connector Sales by Product Type 2018 through 2025F with Percent Change and Five-Year CAGR
- Total World Transportation Market Share by Product Type 2020F
- Total World Transportation Market Share by Product Type 2025F
- Total World Transportation Connector Sales by Product Type 2020F versus 2025F
- North American Transportation Connector Sales by Product Type 2018 through 2025F with Percent Change and Five-Year CAGR
- European Transportation Connector Sales by Product Type 2018 through 2025F with Percent Change and Five-Year CAGR
- Japanese Transportation Connector Sales by Product Type 2018 through 2025F with Percent Change and Five-Year CAGR
- Chinese Transportation Connector Sales by Product Type 2018 through 2025F with Percent Change and Five-Year CAGR
- Asia Pacific Transportation Connector Sales by Product Type 2018 through 2025F with Percent Change and Five-Year CAGR
- ROW Transportation Connector Sales by Product Type 2018 through 2025F with Percent Change and Five-Year CAGR
- Commercial Air
- Commercial Air by Region 2018, 2019, and 2020F with Percent Change
- Commercial Air by Region 2019, 2020F, and 2025F with Percent Change and Five-Year CAGR
- Commercial Air Connector Sales by Region 2020F versus 2025F
- Commercial Air by Product Type 2018, 2019, and 2020F with Percent Change
- Commercial Air by Product Type 2019, 2020F, and 2025F with Percent Change and Five-Year CAGR
- Rail & Rolling Stock
- Rail & Rolling Stock by Region 2018, 2019, and 2020F with Percent Change
- Rail & Rolling Stock by Region 2019, 2020F, and 2025F with Percent Change and Five-Year CAGR
- Rail & Rolling Stock Connector Sales by Region 2020F versus 2025F
- Rail & Rolling Stock by Product Type 2018, 2019, and 2020F with Percent Change
- Rail & Rolling Stock by Product Type 2019, 2020F, and 2025F with Percent Change and Five-Year CAGR
- Commercial Vehicles
- Commercial Vehicles by Region 2018, 2019, and 2020F with Percent Change
- Commercial Vehicles by Region 2019, 2020F, and 2025F with Percent Change and Five-Year CAGR
- Commercial Vehicles Connector Sales by Region 2020F versus 2025F
- Commercial Vehicles by Product Type 2018, 2019, and 2020F with Percent Change
- Commercial Vehicles by Product Type 2019, 2020F, and 2025F with Percent Change and Five-Year CAGR
- Commercial Marine
- Commercial Marine by Region 2018, 2019, and 2020F with Percent Change
- Commercial Marine by Region 2019, 2020F, and 2025F with Percent Change and Five-Year CAGR
- Commercial Marine Connector Sales by Region 2020F versus 2025F
- Commercial Marine by Product Type 2018, 2019, and 2020F with Percent Change
- Commercial Marine by Product Type 2019, 2020F, and 2025F with Percent Change and Five-Year CAGR
- Heavy Equipment and Farm/Garden
- Heavy Equipment and Farm/Garden by Region 2018, 2019, and 2020F with Percent Change
- Heavy Equipment and Farm/Garden by Region 2019, 2020F, and 2025F with Percent Change and Five-Year CAGR
- Heavy Equipment and Farm/Garden Connector Sales by Region 2020F versus 2025F
- Heavy Equipment and Farm/Garden by Product Type 2018, 2019, and 2020F with Percent Change
- Heavy Equipment and Farm/Garden by Product Type 2019, 2020F, and 2025F with Percent Change and Five-Year CAGR
- Recreation Vehicles and Power Sports
- Recreation Vehicles and Power Sports by Region 2018, 2019, and 2020F with Percent Change
- Recreation Vehicles and Power Sports by Region 2019, 2020F, and 2025F with Percent Change and Five-Year CAGR
- Recreation Vehicles and Power Sports by Region 2020F versus 2025F
- Recreation Vehicles and Power Sports by Product Type 2018, 2019, and 2020F with Percent Change
- Recreation Vehicles and Power Sports by Product Type 2019, 2020F, and 2025F with Percent Change and Five-Year CAGR
This is invisible

Bishop & Associates, Inc. has released a new 10-chapter, 253-page research report, providing a detailed analysis of the non-automotive transportation market for connectors. This new report explores the various sectors and sub-sectors of this marketplace, as well as the connector types used within these sectors.
Sectors discussed in this report include:
- Commercial Air
- Rail & Rolling Stock
- Commercial Vehicles
- Commercial Marine
- Heavy Equipment
- Recreation & Power Sport Vehicles
Market values and forecasts covering the period 2019 through 2025F are provided, along with five-year CAGR figures by region of the world, sector and sub-sector.
The non-automotive transportation market includes most vehicles and forms of transportation, except for passenger cars and light trucks and vans. Each of these forms of transportation is designed and engineered to best suit the medium in which it operates: rail, road (on-road and off-road), air, or sea. On one hand, the transportation market is a very diverse market segment which includes huge oil tankers, rolling stock and locomotives, heavy trucks, and construction machinery, as well as commercial jets, ATVs and small recreational vehicles, and farm tractors. On the other hand, these very different vehicles have several things in common:
- They are made to carry and/or move either people or payload.
- They have a form of propulsion and are powered by an engine or motor.
- Until recently, nearly all non-auto vehicles used fossil fuels as their main source of power.
- In the past decade, designers of non-auto vehicles have reviewed conventional propulsion systems and have started using cleaner technologies for generating power.
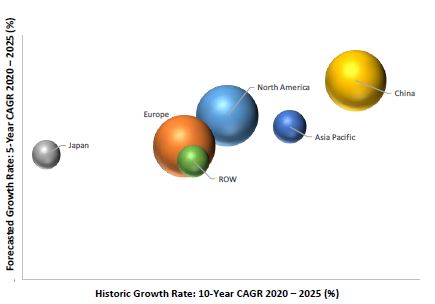
Another aspect that ties all the various forms of transportation together is that data networking (a data bus) has become an essential part of managing and controlling fleet and system operations. This report examines, by transportation mode, the various networking protocols used, and how these networks are altering the transportation sector. In the following graph, the relative size of the connector market within the transportation sector in each region is represented by the size of the bubble. On the x-axis, the average annual compound growth rate (CAGR) of the regional market is plotted over the past 10 years (2009-2019), while on the y-axis, the forecasted five-year CAGR (2020 through 2025) is plotted. This graph shows the Chinese market is poised to outgrow all other regions. As a result, China will become the leading transportation market for connectors in the coming years. North America and Europe are almost equal in size but the North American transportation market for connectors is set to outpace the European market during the forecasted period. Japan, which has experienced several years of declining sales, still lags well behind all other regions
Regulation and standardization are significant factors impacting the transportation industry. Many recent rules and regulations are related to safety and environmental requirements. Most governments, especially those in Europe, Japan, and North America, have set standards for clean air, which impact every vehicle emitting emissions into the atmosphere. China has also started to implement similar requirements. To meet these environmental standards and requirements, engine technology will change, driving early replacement of vehicles or ships with older technology, or non-conforming engines. To meet enhanced safety requirements, increased technology will be implemented, which will also allow operators to detect problems at an early stage. In addition, technology will be added and used to make transportation more efficient. Safety, efficiency, and environmental impact are the three key imperatives driving the transportation industry in the coming years.
Connector consumption in the transportation market sector reached nearly $4.5 billion in 2019, a decrease of 3.8% over 2018, primarily a result of a slowdown in the world economy. The decline was not the same across all sub-sectors, nor is the $4.5 billion evenly distributed across all modes of transportation. Several subsectors, such as commercial marine and rail and rolling stock, performed better than others. At the same time, connector consumption within each subsector varies greatly, with commercial vehicles representing the largest portion of connector consumption and RV and power sports representing the smallest portion. Continued adoption of technologies that will allow OEMs to comply with new rules and regulations regarding emissions and safety requirements, as well as a need to meet efficiency demands and provide an enhanced user experience, will guarantee further growth for connector manufacturers in this market.
Download a descriptive brochure here


