
Connector Industry Forecast
| Report Number: F-2023-02 |
Price:
$5285.00
|
| Publication Date: December 2023 |
This is invisible
PLEASE DO NOT ORDER FROM THIS SITE
Click this link https://bishop-research.com to place your order on our new eCommerce site.
Connector Industry Forecast 2023-2028
2023 has proven to be a year of worldwide conflict and declining connector sales. Are sales anticipated to decline in all regions and market sectors in 2023 or will some fare better? Will growth return in 2024?
- How is the connector industry anticipated to perform in 2023? In 2024? What factors are predicted to contribute to the decline of sales in 2023? Will these same factors affect growth or decline in 2024?
- Which regions, market sectors and subsectors are predicted to show the greatest growth in 2023, in 2024 and in 2028? Which market sectors and subsectors, if any, are anticipated to grow or to contract?
- What outside factors are contributing to connector growth or decline in 2023? In 2024? What factors may affect growth beyond 2023?
- In what way are currency fluctuations impacting connector sales? How is connector backlog changing during the second half of 2023?
Bishop & Associates’ newest research report, the Connector Industry Forecast 2023-2028 looks at past sales and reviews total world connector sales in 2022 and anticipated performance in 2023, providing a comprehensive analysis by region and market sector of projected connector sales for 2023 through 2028. With connector sales broken down by region, market sector and subsector, this report provides a detailed analysis in US dollars of the world connector industry.
2023, unlike the previous two years, is turning out to be a year of worldwide conflict and declining connector sales. Will these unusual times continue into 2024 and beyond, or will we witness growth more in line with historical performance? Be prepared for what lies over the horizon, order your copy of the Connector Industry Forecast.
This is invisible
Connector Industry Forecast 2023-2028
Chapter 1 –2023 – A Year of Worldwide Conflict and Declining Connector Sales
- Bookings Year-over-Year and Year-to-Date
- Billings Year-over-Year and Year-to-Date
- Industry Backlog Shrinks
- Ending Backlog Since May 2022
- Industry Backlog
- Connector Industry Book-to-Bill
- Industry Sales Performance by Region
- 2021 and 2022 Connector Sales by Region with Percent Change
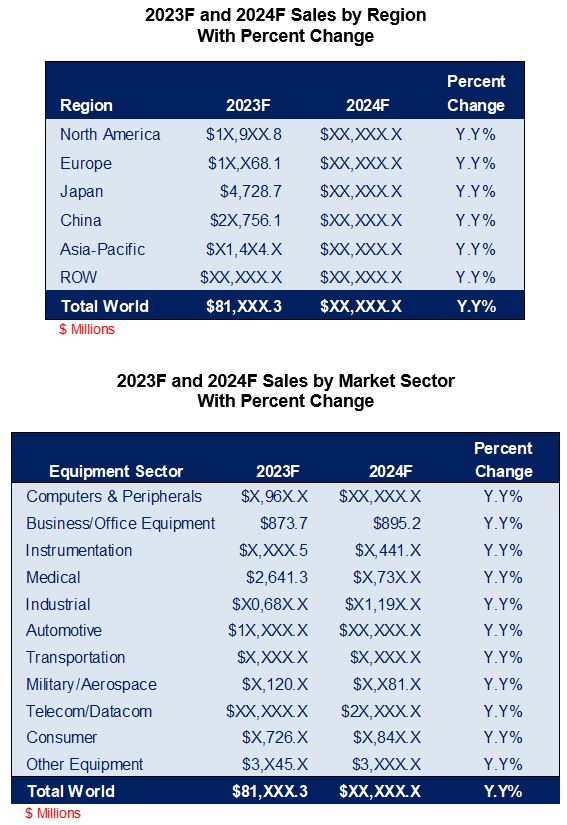
- 2022 and 2023F Connector Sales by Region with Percent Change
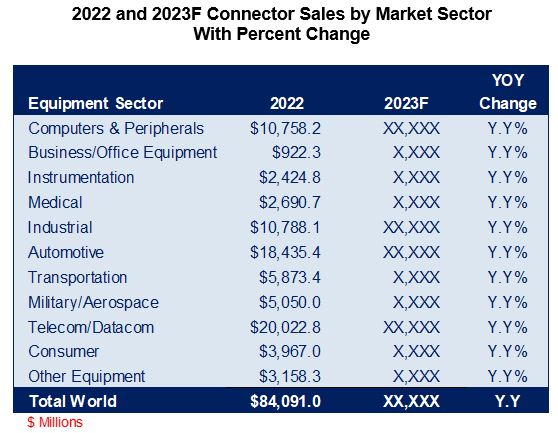
- 2022 and 2023F Connector Sales by Market Sector with Percent Change
- Change in Market Share
- Market Share by Region 2013 through 2023F
- Market Share by Region 1994 through 2023F
- Industry Sales Performance by Month
- Industry Sales Performance by Market Sector 2019 and 2020 with Percent Change
- Change in Percent Growth 2019 versus 2020
- Industry Sales Performance by Market Sector 2020 and 2021 with Percent Change
- Change in Percent Growth 2020 versus 2021
- Industry Sales Performance by Market Sector 2021 and 2022 with Percent Change
- Change in Percent Growth 2021 versus 2022
- Industry Sales Performance by Market Sector 2022 and 2023F with Percent Change
- Change in Percent Growth 2022 versus 2023F
- Industry Sales Performance by Market Sector 2023F and 2024F with Percent Change
- Historical Sales Performance
- Connector Industry Business Cycles Growth Cycles Highlighted
- Historical Percentage Change in Connector Demand
- 2023 YTD Currency Impact on Regional Industry Growth
- Local Currency to One USD October 2022 versus October 2023
- Industry Sales Performance May 2023 USD-vs-Local Currencies
- 2023 and 2024 Outlook
- 2023F Connector Forecast by Geographical Region with Percent Change
- 2024F Connector Forecast by Geographical Region with Percent Change
- Forecast Assumptions
- Five-Year Outlook (2023-2028)
- Five Year Forecast – Region Percent Year-Over-Year Change Sales
- Five Year Forecast – End-Use Equipment Sector Percent Year-Over-Year Change Sales
- Market Outlook and Comments
- Computers-Peripherals Sector
- Overview
- Market Trends
- Global Market Conditions
- Some of the Overall Trends Affecting the Computer Market Sector
- Trends by Subsector
- 2023F World Computer and Peripheral Connector Forecast – Market Share by Region
- Business/Office Equipment Sector
- Global Market Conditions
- Trends by Subsector
- Overall
- 2023F World Business/Office Equipment Connector Forecast - Market Share by Region
- Instrumentation Sector
- Worldwide Instrumentation Market by Sub-Sectors
- Worldwide Connector Market by End-Use Equipment
- 2028 Five-Year CAGR by Equipment Sector
- Worldwide Instrumentation Connector Market by Sub-Sector – 2028F
- Automatic Test Equipment Sub-Sector
- Analytical and Scientific Instruments
- Other Instruments
- Regional Sub-Sector Views
- North America
- North American Instrumentation Connector Sales Forecast 2023F through 2028F
- Europe
- Europe Instrumentation Connector Sales Forecast 2023F through 2028F
- Japan
- Japan Instrumentation Connector Sales Forecast 2023F through 2028F
- China
- China Instrumentation Connector Sales Forecast 2023F through 2028F
- Asia Pacific
- Asia Pacific Instrumentation Connector Sales Forecast 2023F through 2028F
- ROW
- ROW Instrumentation Connector Sales Forecast 2022F through 2027F
- New Product Considerations
- 2023F World Instrumentation Connector Forecast - Market Share by Region
- Medical Equipment Sector
- Global Market Conditions
- Worldwide Medical Connector Sales Forecast Update 2021, 2022, 2023F through 2028F with Percent Change and Five-Year CAGR
- Worldwide Medical Market Sub-Sectors
- Worldwide Medical Connector Market by Sub-Sector 2023F and 2028F
- Diagnostics and Imaging Equipment Market
- Therapeutic Equipment Market Conditions
- Other Equipment Market Conditions
- Regional Sub-Sector Views
- North America
- North America Medical Connector Sales Forecast Update 2021, 2022, 2023F, and 2028F with Percent Change and Five-Year CAGR
- Europe
- Europe Medical Connector Sales Forecast Update 2021, 2022, 2023F, and 2028F with Percent Change and Five-Year CAGR
- Japan
- Japan Medical Connector Sales Forecast Update 2021, 2022, 2023F, and 2028F with Percent Change and Five-Year CAGR
- China
- China Medical Connector Sales Forecast Update 2021, 2022, 2023F, and 2028F with Percent Change and Five-Year CAGR
- Asia Pacific
- Asia Pacific Medical Connector Sales Forecast Update 2021, 2022, 2023F, and 2028F with Percent Change and Five-Year CAGR
- ROW
- ROW Medical Connector Sales Forecast Update 2021, 2022, 2023F, and 2028F with Percent Change and Five-Year CAGR
- 2023F World Medical Connector Forecast Market Share by Region
- Industrial Equipment Sector
- Introduction and Market Definitions
- Traditional Industrial Market - Main Market Segments
- Industrial Internet of Things – IIoT Market Segments
- Key Market Segments for the Industrial Connector Market
- Outlook for the Global Industrial Market for Connectors
- Industrial Connector Market Sales Performance by Region 2021 – 2023E
- Industrial Connector Market Sales Performance by Sector 2022-2024F
- Global Industrial Production 2010-2022
- Regional View
- North America
- Annual YoY Growth Rates and Forecast through 2028 of the NA Industrial Market for Connectors
- Europe
- Annual YoY Growth Rates and Forecast through 2028 of the European Industrial Market for Connectors
- Japan
- Annual YoY Growth Rates and Forecast through 2028 of the Japanese Industrial Market for Connectors
- China
- Annual YoY Growth Rates and Forecast through 2028 of the Chinese Industrial Market for Connectors
- Asia Pacific
- Annual YoY Growth Rates and Forecast through 2028 of the AP Industrial Market for Connectors
- ROW
- Annual YoY Growth Rates and Forecast through 2028 of the ROW Industrial Market for Connectors
- Industrial Market for Connectors – Market Outlook 2023F through 2028F
- Industrial Market for Connector 2021, 2022 and 2023F by Subsector
- Industrial Market for Connectors by 2022, 2023F, and 2028F and Five-Year CAGR by Subsector
- Industrial Market for Connectors Five-Year CAGR 2023F-2028F by Subsector
- Industrial Market for Connectors by Region 2022, 2023E and 2028F
- Five-Year CAGR by Region for Industrial Market for Connectors 2023E-2028F
- Annual YoY Growth Rates and Forecast through 2027F of the World Industrial Market for Connectors
- 2023F World Industrial Connector Forecast - Market Share by Region
- Automotive Sector
- Technology and Market Trends
- Regional View
- North America
- Europe
- Japan
- China
- Asia Pacific
- ROW
- 2023F World Automotive Connector Forecast – Market Share by Region
- Transportation – Non-Automotive
- Commercial Vehicles
- Civil Aviation
- Rail
- RV and Power Sport (Motorcycles, ATVs, and Other Similar Equipment) and Marine
- 2023F World Transportation Connector Forecast – Market Share by Region
- Military/Aerospace Sector
- Global Market Conditions
- 2023F World Military/Aerospace Connector Forecast - Market Share by Region
- Telecom Equipment Sector
- Global Market Conditions
- Technology and Market Trends
- Internet Protocol Equipment
- Regional View
- North America
- Europe
- Japan
- China
- Asia Pacific
- ROW
- 2023F World Telecom/Datacom Connector Forecast - Market Share by Region
- Consumer Electronics Market Sector
- Global Market Conditions & Forecast
- Consumer Electronic Market Segments
- Current Nature of this Market and Connector Applications
- Sun-Sector Performance
- 2023F World Consumer Connector Forecast - Market Share by Region
Chapter 2 – World Connector Forecast
- World Connector Market Forecast – Year-to-Year Dollar Change
- World Connector Market Forecast – Year-to-Year Percent Change
- Top Six End-Use Equipment Categories
- World End-Use Equipment Forecast - Summary
- 2022-2023F Percent Change and 2023F-2028F Five-Year CAGR
- 2023F and 2028F Market Share by Equipment Sector
- World End-Use Equipment Forecast - Detail
- Computers & Peripherals
- Mobile Computers
- Desktops
- Servers
- Storage Equipment
- Input/Output Equipment
- Communication LAN Devices
- Other Computer Equipment
- Business/Office Equipment
- Retail/POS Equipment
- Imaging Systems
- Other Office Equipment
- Instrumentation
- Automatic Test Equipment
- Analytical & Scientific Instruments
- Other Instruments
- Medical
- Diagnostic & Imaging Equipment
- Therapeutic Equipment
- Other Medical Equipment
- Industrial
- Heavy Equipment
- Industrial Automation & Process Control
- Building & Civil Engineering
- Energy Markets
- Machine Tools, Machinery & Robotics
- Other Equipment
- Automotive
- Body Wiring & Power Distribution
- Powertrain
- Comfort, Convenience & Entertainment
- Navigation & Instrumentation
- Safety & Security
- Transportation
- Commercial Air
- Commercial Vehicles
- Rail
- Heavy Equipment
- Recreation
- Commercial Marine
- Military
- Telecom/Datacom
- Carrier Network
- Enterprise Network
- Mobile & Wireless
- Wireless Infrastructure
- Subscriber Equipment
- Cable-Equipment-Infrastructure
- Other Telecommunications
- Consumer
- Personal/Portable Consumer Electronics
- Home Video Equipment
- Home Audio Equipment
- Consumer White Goods
- Other Consumer
- Other Equipment
Chapter 3 – North American Connector Forecast
- North American Connector Market Forecast – Year-to-Year Dollar Change
- North American Connector Market Forecast – Year-to-Year Percent Change
- Top Six End-Use Equipment Categories
- North American End-Use Equipment Forecast - Summary
- 2022-2023F Percent Change and 2023F-2028F Five-Year CAGR
- 2023F and 2028F Market Share by Equipment Sector
- North American End-Use Equipment Forecast - Detail
- Computers & Peripherals
- Mobile Computers
- Desktops
- Servers
- Storage Equipment
- Input/Output Equipment
- Communication LAN Devices
- Other Computer Equipment
- Business/Office Equipment
- Retail/POS Equipment
- Imaging Systems
- Other Office Equipment
- Instrumentation
- Automatic Test Equipment
- Analytical & Scientific Instruments
- Other Instruments
- Analytical & Scientific Instruments
- Other Instruments
- Medical
- Diagnostic & Imaging Equipment
- Therapeutic Equipment
- Other Medical Equipment
- Industrial
- Heavy Equipment
- Industrial Automation & Process Control
- Building & Civil Engineering
- Energy Markets
- Machine Tools, Machinery & Robotics
- Other Equipment
- Automotive
- Body Wiring & Power Distribution
- Powertrain
- Comfort, Convenience & Entertainment
- Navigation & Instrumentation
- Safety & Security
- Transportation
- Commercial Vehicles
- RV’s & Power Sports
- Commercial Air
- Marine
- Rail
- Construction
- Farm & Garden
- Military
- Telecom/Datacom
- Carrier Network
- Enterprise Network
- Mobile & Wireless
- Wireless Infrastructure
- Subscriber Equipment
- Cable-Equipment-Infrastructure
- Other Telecommunications
- Consumer
- Personal/Portable Consumer Electronics
- Home Video Equipment
- Home Audio Equipment
- Consumer White Goods
- Other Consumer
- Other Equipment
Chapters 4 Thru 8 Provide the Same Detail Level as Chapter 3
Chapter 4 – European Connector Forecast
Chapter 5 – Japanese Connector Forecast
Chapter 6 – Chinese Connector Forecast
Chapter 7 – Asia Pacific Connector Forecast
Chapter 8 – ROW Connector Forecast
This is invisible
Connector Industry Forecast 2023-2028
Bishop & Associates has just released the 2023 Connector Industry Forecast update. This eight-chapter report provides an in-depth, and detailed forecast of the worldwide connector industry. In addition to the detailed forecasts for each region of the world (North America, Europe, Japan, China, Asia Pacific, and ROW), an industry overview is included which provides current market trends, currency fluctuation effects, and industry sales performance, as well as an outlook narrative.
Worldwide and each regional forecast includes:
2023 – A Year of Worldwide Conflict and Declining Connector Sales
After a year of strong double-digit growth, no one expected the connector industry to perform as well as it did in 2022. Although not in the double-digit range, growth in 2022 was a solid 7.8%. Entering 2022 with a robust backlog allowed for all regions, except for Japan, and market sectors to show growth, albeit at different levels.
A year marked by challenges, changes, and opportunities, 2022 was for many a year that showed us just how resilient we could be. We climbed our way out of one of the worst health pandemics ever faced. We were faced with flooding in all parts of the world and the worst drought in over 40 years in other parts. Wildfires that burned for weeks and heatwaves, earthquakes, and hurricanes that killed thousands and caused billions of dollars in damages. Yet, after each incident we picked ourselves up, kept a positive attitude, and tended to business. Just like the way the connector industry responded after a devasting 2020.
Industry Sales Performance by Region
As would be expected, growth and decline were not equal across all regions in 2022 nor will they be in 2023. The North American region saw the greatest growth in 2022, growing 14.6%. With growth of 11.7%, the ROW region followed North America. This region includes Central and South America, Brazil, and South Africa. Asia Pacific, which includes Taiwan, South Korea, India, and Singapore as well as a list of others, followed ROW with growth of 7.1%, followed by Europe with growth of 6.5%. China, the largest region for electronic connector sales increased 6.1%. Japan, who continues to struggle to bring sales back to their high of $6.4 billion in 2012, showed the least growth in 2022, with sales declining -2.0%.
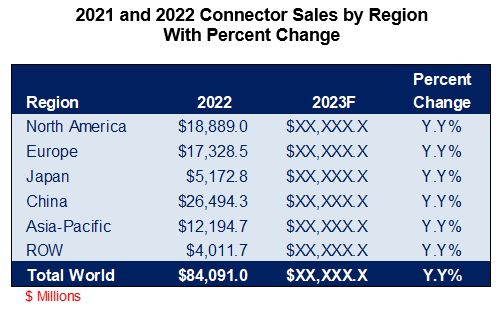
Like 2022, where the region with the greatest percentage increase in sales was the same region that exhibited the greatest increase in total dollars, in 2023, Europe will also represent the region with the greatest overall growth in sales dollars. Europe will see sales dollars increase $XXX million, followed by North America, where sales dollars will increase $XXX million, and ROW where sales dollars will increase $XX.X million. All other regions will see a decrease in sales dollars. Although not the greatest decrease in sales from a percentage standpoint, China will have the greatest decrease in sales from a US dollars point, declining $XXX million. For Japan this will be the second consecutive year of sales decline.
In addition to connector sales results varying by region in 2023, electronic connector sales will also vary remarkably by market sector. As the table below and on the following page show, in 2022, the telecom/datacom market, which encompasses a variety of equipment types including carrier network, enterprise network, wireless infrastructure, subscriber equipment (cell phones), and cable equipment saw the greatest percentage growth, at 9.4%. Naturally this growth was driven by the increase in internet activity and the continuing drive towards 5G. In 2023, although nowhere near the growth in 2022, the telecom/datacom market will once again show the greatest growth, expanding by 0.8%. In 2022, the telecom/datacom market was followed by the automotive, transportation, industrial and military/aerospace market, all growing 8.1%. It is important to note that although the percentage increase for all four market sectors is the same, because the value of each market is so different, the change in sales dollars varied tremendously. In 2023, the telecom/datacom market will be followed by the military/aerospace market, with growth of 0.6%. It has not been since 2019, that the military/aerospace market out preformed key markets like automotive and industrial, but unfortunately worldwide turmoil has put military/aerospace expenditures in the spotlight.
2023 and 2024 Outlook
With industry backlog declining steadily, Bishop is forecasting 2023 sales to decline -Y.Y% to $XX,X16 million. We anticipate the greatest percentage decrease will occur in Japan, where sales will decrease -Y.Y%, followed by the China region where sales are anticipated to decline -X.X%. When looking at growth in US dollars, although not the greatest decline percentage
wise, the smallest growth will be seen in the Chinese region, where connector sales will decrease by $XXX.X million. The Chinese region will be followed by the Asia Pacific region, where sales in US dollars will decline $XXX million.
Forecast Assumptions
Forecasting is always difficult, especially during times of financial and geopolitical uncertainty. Projecting future business conditions in this environment is almost impossible. Consider the following economic headwinds, political challenges, and uncertainties.
- Economic markets are still unstable. Although the Federal Reserve announced in early November that they would hold rates steady as they evaluate progress on taming inflation, they did leave the door open to future increases. This contrasts with their announcement in September that one more increase in rates was likely to occur in 2023 to keep inflation at bay. This is important because US interest rates tend to drive global rates and strengthen the US dollar, which causes many other currencies to depreciate.
- World GDPs are slowing in all economies. According to The Conference Board, “global real GDP is forecasted to grow by 2.9% in 2023, down from 3.3% in 2022”, with a further decline to 2.5% in 2024. “Growth forecasts for 2024 are generally strongest in emerging Asian economies and weakest in Europe and the US.”
- Although global supply chain issues have improved drastically, with ocean and truck freight capacities improving, we still are faced with several obstacles driven by issues such as labor shortages and global conflicts. In the latest CNBC Supply Chain Survey, conducted in October among logistics executives from companies like DHL Global Forwarding Americas, ITS Logistics, SEKO Logistics, C.H. Robinson, and Kuehne + Nagel, it was determined that the freight market will remain stagnant through the balance of 2023, and that “little to no growth will occur during the first half of 2024”.
- Continued fluctuation in petroleum prices. Although at the present time, prices seem to have dropped about $0.30 per gallon when compared to this time last year, there is no guarantee how long these prices will remain in effect. The fact that Saudia Arabia the world’s second-largest oil supplier, decided to slash production by one million barrels a day since July, means less oil available and in turn potentially higher prices. The fact we are now entering the time of year where demand drops for gasoline is good for the consumer, but demand for diesel by farmers and truckers, as well as jet fuel for the rebounding travel industry, will add to the price of goods.
- Low unemployment rates, driven by the ongoing labor shortage, with studies still showing that by 2030, we will be an estimated 85 million workers short globally! Continued low unemployment rates worldwide, driving a continued and prolonged shortage of workers in key areas like transportation and service industries. Through September 2023, unemployment in the US stood at 3.8% and in China at 5.0%. In the Euro area through August, it was 6.4%.
- Increasing political tensions: Israeli-Palestinian conflict over land and who controls it, a war between Russia and Ukraine that has gone on for over a year, with no end in sight, deepening friction between China and Taiwan with the US trying to maintain dominance in Asia Pacific, possible repeated confrontation between Armenia and Azerbaijan, stalled nuclear talks with Iran, political gridlock and rampant gang violence in Haiti, with cholera spreading and governmental services collapsing. China’s continued military buildup, which includes rapid development of its nuclear, space and cyberspace capabilities. According to Defense.gov, “DOD officials estimate that the Chinese had more than 500 operational nuclear warheads as of May 2023.” “China has also focused on expanding its naval capabilities to project power by sea. It has the largest navy in the world, in terms of number of ships and submarines, with a total battle force of 370 ships and submarines. That includes 140 major surface combatants, according to the report.”
- A global housing shortage is causing home prices and rents to climb substantially, drastically affecting the percentage of income devoted to housing. In some countries like Germany, this has reached disastrous proportions. Earlier in 2023, a study by the Eduard Pestel Research Institute “found there to be a shortage of more than 700,000 apartments in Germany, especially in the affordable segment”. Germany is not the only country where rentals are a scare commodity, many other European countries are facing the same dilemma, and even those that have found housing, in many countries like the United Kingdom, this housing is substandard, with many in a state of dangerous disrepair. The United States is also facing a housing shortage, due to rising material costs, labor shortages, and supply chain issues. Although this problem existed long before COVID, rising interest rates have caused buyers to watch their purchasing power plummet, as well as their ability to own a home.
There are also some interesting projections as to why we will see connector growth in 2024 and beyond and what that growth will be. See the markets where Bishop anticipates growth and which subsectors will drive that growth. Look at projections over the next five years. Will we continue to grow, or will some years not be as strong as others? All this and more revealed in the December 2023 Connector Industry Forecast.
Download a descriptive brochure here


